Tag: twitter advertising

Introducing Monitoring, Editing & Creation of Twitter Ads

Yesterday, we announced the integration of Twitter’s Ads API with our Social Operating Platform, making Unified one of only two companies in the world with Ads API access to all three major social networks – Facebook, Twitter and LinkedIn.

This integration was much more than just adding a few form fields and API calls – we thought hard from the ground up about how to create the simplest and fastest interface to manage thousands of ads across dozens of accounts.

We’re really proud of the Twitter product we built over just eight weeks, and excited to continue building the absolute best product for our customers. Today I want to share three fundamental principles that have guided our design and engineering process so far.

Design to match data structure

Advertising data is like a set of Russian Dolls – deeply nested data structures that in their simplest form look something like:

image

When we started prototyping, the goal was for our product to help customers understand this information hierarchy and use it to their advantage.

In order to reflect this hierarchy in our design, we hacked around CSS, HTML tables andbackgrid.js to create this:

image

Each campaign row expands and collapses, clearly displaying the full hierarchy and interface without navigating back and forth between pages and views. Analytics, editing, and creation all happen from the same interface, helping you make smarter decisions about your campaigns.

We’re really excited to continue refining this approach and finding the best design pattern for nesting and mixing tabular and non-tabular data like this. (if you have ideas, we’d love to hear from you)

When editable data is visible, it should be editable in-place

image

If I can see my campaign budget, why shouldn’t I be able to click on it and change it right away?

When we looked at other designs for editing ads, one anti-pattern we found was a reliance on multi-step wizards to make simple changes. Wizards are ideal for guiding new users through a process, but using them for editing is a crutch.

By allowing quick Excel-style edits, we were able to reduce the time it takes to make changes down to less than a second – just click, edit, and hit enter.

Confirm success and explain failure

When an advertiser has hundreds of thousands of dollars at stake, it’s absolutely essential to provide them with confirmation that each action they take in our application succeeded or failed.

We do this by hooking messenger.js into every action and displaying a small notification in the bottom right corner of the browser window:

image

As a user, you shouldn’t have to wonder whether your request to the API worked, or whether your spotty 3G connection sent your changes – you should always have full visibility into both success and failures.

Looking to the Future

With a solid foundation to build on, we’re excited to keep building and focus on solving the challenges that our biggest advertisers face, from multivariate testing to automated targeting and beyond. Expect to hear more from us here on the blog as we keep building and making it easier to create and manage Twitter campaigns.

How the Bones Brigade tweeted their way to 6-figure sales

Content originally written by Jonathan Strauss and published on the awe.sm blog

One of the coolest things about working at awe.sm (in addition to the team, and the view :D ) is seeing all the exciting things our customers are doing with our platform. That’s especially true of our friends at Topspin Media, who have made us a part of projects for some of our team’s favorite artists, like the Beastie BoysYeasayer, and in Tilly‘s case, Kreayshawn ;-). But for several of us, having what we’ve built be an integral part of the amazing and amazingly successful direct-to-fan release of the Bones Brigade documentary made our jobs cool to our 12 year-old selves.

image

Personal satisfaction aside, this project and the data that the filmmakers and Topspin will be sharing at Sundance this week are nothing short of a revolution in film distribution. If you’re into the business of content, you should read more about the overall release on Topspin’s blog. The quick summary is that through an innovative combination of viral marketing, well-designed windowing, and creatively tiered pricing the producers were able to build an email list from 0 to more than 46,000 fans in just 2 months and ultimately make nearly 4 times the money they were offered in a conventional distribution deal.

Sharing drove 10% of the total revenue from the release. And thanks to deep awe.sm integration excellently implemented by the experts at The Uprising Creative, we tracked the value generated by each individual Tweet and Facebook post. Measuring the ROI of sharing is what awe.sm was built to do, and we have fascinating data on conversions from sharing across our hundreds of customers. But the unprecedented transparency of the Bones Brigade filmmakers is allowing us for the first time to publicly share some of the incredible insights we deliver our customers everyday.

image

Topspin’s strategy was to use the existing fan-bases of the Bones Brigade members, including Tony Hawk’s 4.2m Facebook fans and 3.3m Twitter followers, to get the word out to the core most passionate fans first and then encourage those fans to spread the message to their friends. This approach was extremely successful in driving a significant volume of high-value traffic with an average value of $1.59 per visit ($2.11 per visit from sharing by the cast and $1.21 per visit from sharing by ordinary fans). Being able to track the value of each share and the relationships between shares gives you visibility into the mechanics of how and why sharing is effective and not just the end results. This is essential to understanding the patterns of success and how to replicate them.

Here are some of the most interesting patterns we observed in the Bones Brigade sharing data:

  • Fans were more than 7 times as likely to share to Facebook than to Twitter (87.8% of fans shared to Facebook vs 12.2% to Twitter);
  • The value per visit from a fan’s Facebook share was more than 2 times higher than that from a fan’s Twitter share ($1.29/visit from Facebook vs $0.60 from Twitter);
  • Sharing by the cast (i.e. “Celebrities”) was roughly even to both Facebook and Twitter but drove 82.0% of revenues from shares to Twitter and 18.0% from Facebook;
  • However, the value per visit from the cast’s shares to Facebook and Twitter was roughly equal ($1.93/visit from Facebook vs $2.07/visit from Twitter);
  • Sharing by the cast to Twitter drove more than twice as many visits per share as Facebook and more than 2.5 times the visits per fan/follower (1.10% eCTR for Facebook vs 2.82% eCTR for Twitter).

image

This stark contrast between the performance of sharing by celebrities vs ordinary fans across Facebook and Twitter demonstrates several underlying (and somewhat related) phenomena:

  • Normal people primarily use Twitter to discover content and Facebook to share it with friends – The overwhelming volume of fan sharing to Facebook (87.8%) clearly demonstrates that most people do not view Twitter as an important personal sharing channel, but the fact that Twitter was still able to drive 40.3% of the traffic and 47.3% of the revenue (primarily from celebrity sharing) shows that there is still a significant audience discovering and consuming content through Twitter despite their lack of sharing;
  • Twitter is a network of loose ties and Facebook is a network of strong ties – Visits driven by celebrities had roughly equivalent value across Facebook and Twitter while visits driven by regular fans were more than twice as valuable on Facebook than on Twitter, which demonstrates that consumers have tighter connections with and are more swayed by the recommendations of their friends on Facebook than by the non-celebrities they follow on Twitter;
  • Twitter followers are more likely to click than Facebook fans – Whether it’s an impact of NewsFeed Optimization or just a side-effect of the fact that normal people are primarily using Facebook to share with and consume from their friends and family, the numbers show that celebrity sharing to Twitter is driving over 2.5 times more visits per follower than sharing to Facebook is driving visits per fan with a roughly equal value per visit.

We’ll be taking a deeper look at each of these topics in upcoming blog posts. So follow @Unified on Twitter to learn more about this amazing campaign.


Twitter drives 4 times as much traffic as you think it does

Over the last few weeks, TechCrunch has run a couple posts using their own referrer logs to measure how sharing on various social services drives traffic. In these and other analyses based solely on referrer information, Twitter performs surprisingly poorly relative to expectations many of us have based on our own observations of the volume of link sharing on Twitter.

Does that mean the people you follow on Twitter who share links all the time are that atypical? Do most normal people just not click on links in Tweets? Is LinkedIn far more popular with the rest of the world than it seems to be with the people you know?

No, no, and no. There is a much simpler answer behind this disparity: referrers are a poor way to attribute traffic from social sharing.

Referrer analysis is based on the outdated metaphor of the web as a network of links between static pages that could only be navigated by browsers. Today’s web is built around social streams and other APIs that are consumed via dynamic web applications, desktop clients, mobile apps, and even other web services, all of which render referrers obsolete as an attribution mechanism.

awe.sm was built for the modern web — a network of people, not pages — to track the results of Tweets, Likes, emails, and other sharing activities no matter what path they follow. So our system knows with certainty where each link was originally shared in addition to all the places where it was ultimately clicked (i.e. referrers). This approach gives us a unique set of data that demonstrates just how misleading referrer information can be.

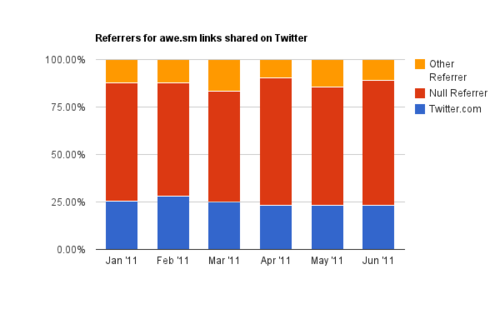
And in the case of links shared on Twitter, it’s very misleading: the referral traffic one sees from Twitter.com is less than 25% of the traffic actually driven by Twitter.

Twitter is the perfect storm for referral traffic

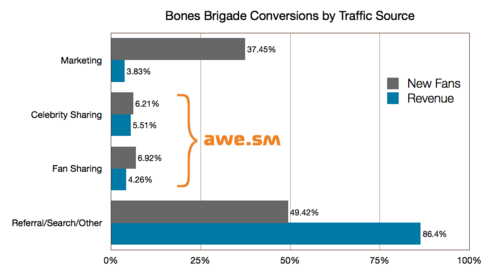
We looked at awe.sm data from the first 6 months of 2011 spanning links to over 33,000 sites, and the numbers were astounding:

  • only 24.4% of clicks on links shared on Twitter had twitter.com in the referrer;
  • 62.6% of clicks on links shared on Twitter had no referrer information at all (i.e. they would show up as ‘Direct Traffic’ in Google Analytics);
  • and 13.0% of clicks on links shared on Twitter had another site as the referrer (e.g. facebook.com, linkedin.com).

image

Twitter is the quintessential modern web service — all the ways to consume Twitter, even Twitter.com, are just clients for the Twitter API — so the failure to effectively track it using such an outmoded methodology as referrer analysis should come as little surprise. Twitter’s openness and the many resulting ways users interact with it are what have made it so successful, but they are also the things that have made its value largely invisible to publishers.

‘Direct Traffic’ explained

When a user clicks a link in any kind of non-browser client, from Outlook to a desktop AIR app to the countless mobile and tablet apps, no referrer information is passed for that visit and your analytics software basically throws up its hands and puts the visit in the ‘Direct Traffic’ bucket. The assumptions behind this fallback behavior show just how arcane referrer analysis is — if a visit didn’t come from another webpage (i.e. no referrer data), someone must have typed the URL directly into their browser address bar.

How Twitter sends traffic through other sites

If you’ve spent the last few years wondering why the proportion of ‘Direct Traffic’ to your site has been on the rise, the answer is the growing usage of non-browser clients, especially on mobile. And since 2/3 of Twitter consumption is happening in desktop and mobile clients*, it’s safe to say that a lot of your ‘Direct Traffic’ is actually coming from Twitter.

While the incredible growth of mobile apps and desktop clients and their importance in the Twitter ecosystem is news to no one, the value Twitter drives through content syndication is a bit more surprising: more than 1 in 8 visits driven by Twitter sharing are actually referred from other sites. Many other sites use Twitter’s API to pull in Tweets that they display on their own sites, where links in those Tweets are then clicked.

image

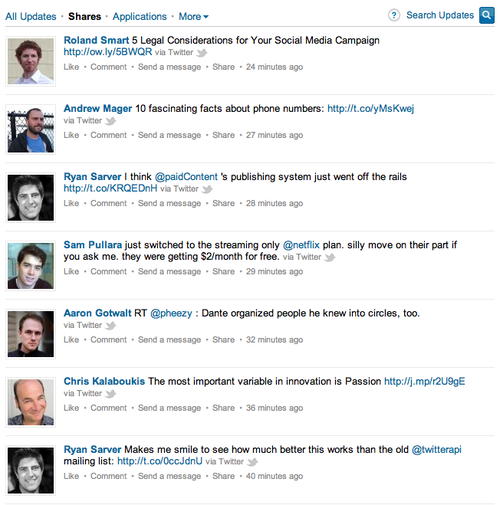
For example, look at this screenshot of my LinkedIn activity stream. Notice that every update says ‘via Twitter.’ Yet when someone clicks on one of those links, the referrer will be linkedin.com, even though it only got to LinkedIn because someone shared it on Twitter first.

The same is true of Tweets syndicated to Facebook, About.Me, and myriad other websites that allow users to connect your Twitter feed directly. And because Twitter’s API is open and most Tweets are public by default, there are also many applications and sites that display Tweets based on hashtags, search terms, and other criteria without a user ever needing to connect their own feed.

In addition to the programmatic syndication of Tweets through Twitter’s API, sharing is fundamentally social and the human element is responsible for much of the serendipity that makes social media so powerful. A great example of that is this Tweet by @zeyneparsel, who only had 144 followers at the time. However, she happens to be a self-proclaimed “veteran hipsterologist” and this Tweet was on the subject of hipsterism (?!). As a result, the link contained in her Tweet ended up being included in a Psychology Today blog post on hipsterism (see UPDATE 3), which drove a significant amount of traffic.

In these cases, which showcase the amplification effect that makes Twitter so uniquely valuable to publishers and marketers, analyzing referrer data alone would attribute traffic to a variety of other sites, even though it all originated with sharing on Twitter.

Improving social attribution

Last week, MG Siegler noted that Google+ started rewriting all outbound clicks to come from plus.google.com. Facebook has rewritten outbound links for quite a while due to phishing/malware and privacy concerns. And both LinkedIn and StumbleUpon frame all external pageviews, which means you can see all the views they drive. As t.co rolls out to 100% of the links shared on Twitter (a topic we’ve previously covered in some depth), they may very well start rewriting all clicks on t.co links to show Twitter as the referrer. This would ensure Twitter gets the credit they deserve for traffic they send to publishers, but it would have the downside of obfuscating the diverse paths that a tweeted link can take.

Until then, it’s possible to correctly attribute visits driven from Twitter sharing by tagging your outgoing links using a solution like Google Analytics campaign tracking parameters. For example, the Tweet Buttons on Business Insider use links like this:

http://www.businessinsider.com/closing-bell-july-12-2011-7?utm_source=twbutton&utm_medium=social&utm_term=&utm_content=&utm_campaign=moneygame

Google Analytics can then properly attribute traffic to those buttons. Google Analytics offers a handy URL Builder tool, and other analytics solutions, like Omniture, support similar campaign tracking parameters of their own.

Why awe.sm is, well, awesome :D

And if all you want is an accurate count of the aggregate traffic Twitter drives to your site, that should be enough. But our customers have found there’s a lot more value to be had in understanding the mechanics that drive successful sharing — who is tweeting, what they’re tweeting, where it’s being tweeted from, when it’s being tweeted, etc. So in addition to automatically building the outbound links to integrate our social attribution with Google Analytics, Omniture, and other web analytics solutions, awe.sm tracks the performance of each Tweet (and Like, etc) individually. By connecting the rich information we have about the context of each share with the visits, pageviews, conversions, and revenues it drives, we enables our customers to go beyond just looking at social data and to start acting on it (and to build cool stuff like this).

If you’re interested in learning more about how awe.sm can help your business harness the value of social, please drop us a line here.

* The full list of sources of clicks with no referrer information (i.e. ‘Direct Traffic’) not only includes mobile and desktop clients, but also web-users who have https security enabled for their Twitter accounts (which strips out referrer information).

*Content originally published on the awe.sm blog.


© 2014

Theme by Anders NorenUp ↑