Category: Facebook Advertising (page 1 of 3)

5 Things You Need to Know about Facebook’s Right Hand Column Redesign

image

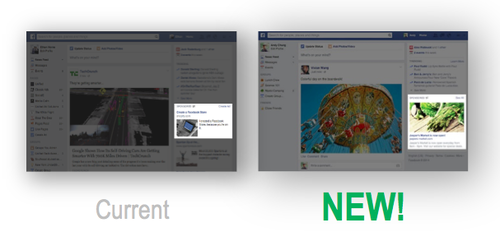
This past April, Facebook announced a complete redesign of their right hand column (RHC) ad products and as of June 24th, we’re starting to see the new layout pop up live on the site.

Now, we know what you’re thinking:  Facebook has made changes in the past… What’s so special about this one and how will it affect my social campaigns?

As it turns out, unlike many of Facebook’s design updates, this release is a bit more exciting in that it allows you to draw more attention to your right hand column ads with a visual layout that’s more consistent with the those that appear in the News Feed.

As you well know, your audience engages heavily with images throughout their social experience — and the new right hand ad allows you to play into this via paid campaigns. Rather than come off as an interruption or intrusion, the new layout allows your ads to better compliment your audience’s social experience.

Here’s a look at the top 5 things you need to know about the release:

1)     Bigger Share of Voice

With the new design, brands will have a bigger share of voice (SOV) on all of Facebook. Users will see only two of the larger ads on all pages including the Homepage. You will no longer need to fight as hard for clicks and will have more of your audience’s attention.

2)     More Engagement for Everyone!

image

Facebook is reporting that they saw 3x the engagement with the new layout as compared to the previous design. As a result of obtaining more valuable real estate, the layout aims to produce more qualified clicks from a precise audience.

3)     Consistent Look = Positive Perception

Previously, News Feed ads reported a significantly higher CTR compared to RHC ads. With this release, the RHC ads will resemble News Feed ads — encouraging users to have a more positive perception of the RHC ads and increased engagement.

4)     The Magic Number =  1.91:1

image

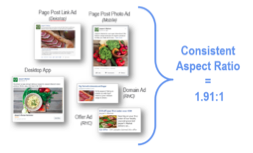
The new ads will leverage the same aspect ratio (1.91:1) as ads within the News Feed, allowing for seamless campaign set-up, cohesive creative, and saved time. Marketers will no longer need a unique image for ads in the right-hand column. Additionally, RHC ads will be restricted to the same 20% text per photo policy that is enforced across New Feed ads.

5)     Profit off of early adoption

Facebook started displaying the new Right Hand Column ad layout as of June 24th. Upon each page load, users will see either the new layout with only 2 ads in the RHC, or the older layout with multiple ads. We recommend you update your existing campaigns ASAP to take advantage of the new layout as you’ll be one of the first to grab the attention of your audience using the new look and feel. Plus, you’ll want to start collecting data/results using the new layout so you can start optimizing your campaigns accordingly.

Timing and Next Steps

Facebook is allowing advertisers a grace period before you are required to move existing RHC ads to the new format. You have until September 1st to update creative. After that date, Facebook will stop delivering all ads with outdated creative.

 image

We are excited to see how the new design will not only drive more qualified traffic, but also help marketers drive reach in a cost-effective manner.  With bigger real estate, increased engagements, and more SOV brands are almost guaranteed to see a positive ROI.

Leave us a comment and let us know how your campaigns perform in the new layout.

Questions? We’ll be watching the comments here so leave us a note and we’ll do our best to help.

The $65,000 Tweet: how to track social media marketing to offline sales

image

Welcome back to our ongoing series on building and optimizing a performance-driven social media marketing program.

In part 1, we discussed how to classify social media. In part 2, we evaluated how you can consider social media as a marketing funnel (and why you ought to). Last week, we explored the funnel of a customer whose conversions take place in a shopping cart. That brings us here.

Believe it, kid: crazily enough, there are, in fact, such things as offline transactions. Marketers use social media to drive these transactions, too — and, just like social flows that end in an online shopping cart, such transactions have a funnel and an ROI that marketers can measure and optimize.

But how?

What if my conversions happen offline?

image

Last week, we checked in on an awe.sm customer whose social funnel drives customers to make purchases — and, by taking a close look at sharing in every stage of the funnel, uncovered a new source of traffic and revenue. If you’re an online retailer, you absolutely should take a look.

For many more of our customers, there isn’t a shopping cart at the bottom of their social funnel, but something more amorphous — app downloads, for example; or lead-gen form submissions; or maybe even just pageviews. We can track those, too. We can track anything.

But about two years ago, awe.sm got to start working with a customer whose social funnel does end in a purchase — but one that doesn’t happen online. It was up to us to help connect the cyberspace top of the funnel with the meatspace conversions at the bottom. Here’s what that looked like.

Baby, you can drive my car / and maybe I’ll retweet you

image

Cars are huge on social media, and not the Pixar movies my godson has made us watch 479 times, but the real ones. Watch your Twitter stream during the Detroit Auto Show to see the volume of conversation that new models inspire, and scrub your friends’ profiles to see how long it takes before you find one of YouTube’s millions of my-new-car selfies.

But did you ever wonder how Tweets about cars actually translate into car sales? Our automaker friends did. So we took a look at their funnel.

Here’s an example funnel:

  1. See the brand’s Tweets;
  2. Engage with a Tweet by (e.g.) favoriting or amplifying;
  3. Click from the Tweet into the dealer’s site;
    ____________________
  4. Browse to a specific model;
  5. Navigate content (a.k.a., activate salivary glands);
  6. Enter car customizer;
  7. Complete car customizer;
  8. Search for a local dealer;
  9. Schedule a test drive;
    ____________________
  10. Test drive (a.k.a., re-activate salivary glands);
  11. Negotiate;
  12. Yahtzee!

Tracking this funnel may seem like a tall order — it spans social, web, and offline!… — but we weren’t starting from scratch. All the data needed for funnel analysis already is out there:

  • The brand’s dealers maintain impeccable tracking to understand the performance of each channel that drives customers into their showrooms — in other words, everything that happens in real life, below the red line.
  • Everything in the middle of the funnel — the steps between the blue and the red lines — happens on the brand’s site. Here, the brand’s own site analytics team pays close attention to site visitors, measuring and optimizing their acquisition, navigation, and conversion.
  • The top of the stack is the social funnel — and that, of course, is awe.sm’s wheelhouse⁴.

We authenticated awe.sm tracking on the brand’s owned social channels; instrumented awe.sm conversion tracking at important milestones in their website, like entering the car configurator; and matched up our metadata with the site analytics tags already in place.

By closing the loop and connecting all the dots from post to purchase, we were ready to learn the ROI of each Tweet … and it blew our minds.

When is a Tweet worth a car?

image

If you make it through step 6 of this funnel — if you finish configuring a car on the brand’s site — there is a 30% chance you will buy the car. Yes: if you make it halfway through their funnel, the odds are nearly 1 in 3 that you’ll finish it.

Holy moly.

So: if our customer can tweak their social funnel to get only three more people through the funnel, that’s a new car.⁵ Here, identifying which specific social posts perform at each stage of the funnel ceases to be academic or merely curious — and every optimization that increases reach, engagement, and traffic is serious business.

YMMV⁶

image

Does this mean you should organize your social media marketing exactly like an auto brand’s? Probably not — not even if you’re another auto brand, since each brand’s followers are unique. But our takeaways are these:

  • You don’t need e-commerce to track the ROI of your social media marketing;
  • You definitely can track the ROI of your social media marketing: it’s just a matter of closing the attribution loop;
  • … and you should: even if this is an extreme example, it’s inescapable that individual social posts can have a huge impact — so you need to understand the performance of each one.

What would it take to get you into this social media attribution platform today? … No, really. Let’s talk about this. Drop us a note, kick the tires, and let’s optimize your social media marketing.

____________________

² Ugh — totally unintentional. I really need to brake this habit. For wheels
³ I’m steerious.
⁴ Sorry; it happened again. Guess I’m just not firing on all cylinders.
⁵ Second prize: steak knives.
⁶ Oh, come on; you saw that coming a mile away. Don’t blow a gasket.

*Originally published on the awe.sm blog

Facebook News Feed Updates: What You Need To Know

Ask any experienced Facebook marketer how to succeed on Facebook and invariably they’ll mention the News Feed. This river of stories is the core of the Facebook experience. So when Facebook tweaks the News Feed algorithm (formerly called EdgeRank), marketers need to adjust their content strategy.

Facebook just announced that starting January 21st, text posts from Pages will have a lower weighting in the News Feed algorithm.

Text status updates look like this:

While they can include links, they don’t include photos, videos, or link previews. For example, the status update above includes a link, but no preview. The link post below includes a full link preview:

Post reach is a function of fan engagement and algorithm weighting. As a result of Facebook’s algorithm change, a link post that includes a link preview will generate more impressions-per-engagement than a simple text status update that includes a link but no preview.

Most content strategies incorporate a number of different types of posts. Some posts are focused on getting the word out. For these FYI posts, the goal is to maximize impressions/reach. When posting these, experiment with link posts instead of text status updates because that avoids the reduction in reach for text status updates. For example, take a text status update like “Our credit card processing system just passed the latest security audit,” and add a link to a webpage about credit card security.

Other posts focus on building a brand by establishing rapport with customers. These posts generally focus on driving deep engagement with your core audience—you don’t want someone to just see a status update, you want to actually generate an emotional response. Text status updates and photos are both effective at driving this deep engagement because they focus on the essence of the post without distraction. For example, if a bakery posted “Banana bread: Better with or without chocolate chips?” they will likely generate more engagement if they don’t include a link.

While it looks like a link post, this is actually a photo upload that includes a link in the caption.

Finally, some posts are focused on getting users to click through to a website. While you can put the link in either a text status update, a photo caption, or a link status update, across our customer base, link posts are already the consistent winners at driving traffic. After this change to the News Feed algorithm, we expect link posts to outperform plain text updates by an even greater margin.

Regardless of the type of post, if you put paid spend behind your posts then it’s important to monitor their performance in real-time. Don’t use advertising dollars to prop up boring content, use it to accelerate successful content. Unfortunately, no marketer can predict with 100% accuracy which posts will flop and which will succeed. So use a real-time analytics tool like Unified Now to move advertising dollars away from posts that are flopping and toward posts that are succeeding – and remember that you should make that determination within the first 24 hours.

All page audiences are different, and it’s important to figure out what works for you and your audience. Some audiences engage more with links, some with pure text. If your fan base strongly prefers text updates, you might find the extra engagement is a stronger factor than the lowered algorithmic weighting.


Infographic: Entertainment Advertising on Facebook

Global revenue for the entertainment industry is expected to top $1.4 trillion dollars by 2015, and smart entertainment marketers have found remarkable success using Facebook to reach consumers.

Our latest infographic explores how the entertainment industry differs from other vertical markets on Facebook, including how men and women differ in their interactions with entertainment advertising.

Read on to learn more about what drives marketers’ entertainment success.

As with all of Unified’s infographics, feel free to repost using the embed code you’ll find here.

Entertainment Industry Facebook Advertising Benchmarks

Infographic: CPG Advertising on Facebook

Nearly two trillion dollars are spent on consumer packaged goods (CPG) globally each year, and smart CPG marketers have found remarkable success using Facebook to reach consumers.

Our latest infographic explores how the consumer package goods industry differs from other vertical markets on Facebook, why the mobile News Feed is key to marketing success, and how men and women differ in their interactions with CPG advertising.

Read on to learn more about what drives marketers’ CPG success.

As with all of Unified’s infographics, feel free to repost using the embed code you’ll find here.


Consumer Packaged Goods (CPG) Facebook Advertising Benchmarks

Benchmarking Facebook Advertising Performance Across Fourteen Different Industry Verticals

The Unified research team has unique access into one of the social marketing industry’s deepest data sets.  One of the most common requests we receive is “Can you give us benchmarks specific to our industry? Average benchmarks aren’t useful to us because everyone in our industry [under/over] performs the average.”

When you think about it, such requests make complete sense.  For example, an ad for a new movie will perform very differently than an ad for a bank.

In response to repeated requests, today we’re releasing a new report measuring Facebook ad performance across fourteen different industry verticals.

tl;dr: Want to go straight to the report? Download it here:http://www.unifiedsocial.com/data-study/facebook-advertising-benchmarks-industry-vertical/

image


This report examines cost per impression (CPM), cost per click (CPC), and cost per like (CPL), as well as clickthrough rates (CTR).

Some highlight findings:

  • Ceullular & Telco advertisers acquire fans 91% cheaper than average.

image

  • Food ads are 58% more likely to be engaged with than the average Facebook ad. This is twice as high as any other vertical.

image


These are the industries we benchmarked:

  • Alcohol
  • Automotive
  • Consumer Packaged Goods (CPG)
  • Education
  • Electronics
  • Entertainment
  • Financial Services
  • Food
  • Gaming
  • Home Improvement
  • Consumer Web Services
  • Desktop Software (No games)
  • Cellular & Telco
  • Travel

Download the full report here: http://www.unifiedsocial.com/data-study/facebook-advertising-benchmarks-industry-vertical/

If you’re a social marketer, one of the first questions that should spring to mind when looking at this data is, “How can I use this data to improve my campaigns?”

Use the metrics to identify where you should focus on improving. Some industries excelled at getting initial user engagement but struggled to turn those users into fans. So those industries should optimize what happens to a user after they initially engage with an ad. Some industries had a lower than average engagement rate, but those users who did engage were highly engaged. Those industries should work harder to drive that initial user response because the rest of their marketing funnel is already highly-optimized.

These verticals had lots of clicks, but relatively low percentage of clicks converted into fans:

  • Food
  • Automotive
  • Financial Services

Ads for these verticals had a low engagement rate, but users who clicked were very likely to convert into fans:

  • Cellular & Telco
  • Gaming
  • Desktop Software
  • Alcohol

If you’re in this group, experiment with broadening your targeting a little. Yes, the followthrough rate will probably slightly decrease, but you might be surprised to find that your ad cost decreases even faster, resulting in an overall lower cost per acqusition.

As you flip through the report, you’ll notice there’s a massive disparity between different industries. Two primary reasons for this:

First, different target markets vary in competition for users’ attention. For example, an industry that primarily markets to moms tends to have far more competition than an industry that markets to teenage girls. Moms have a lot more spending power so there’s a lot more advertisers who want to have their ad placed in front of that mom, so they bid up the prices for those ad slots. An advertiser who can make 50% more profit from a mom is happy to pay 40% more to reach moms than teenagers because that leads to a 10% profit boost.

Second, even within the industries vying for the same target market, some of those industries are more interesting to users, which means the more interesting ads will require fewer ad impressions to drive the same engagement level. For example, an ad for a popular movie generally requires fewer ad impressions to convert a user into a fan than an ad for insurance. So any ad prices that include user behavior, such as cost-per-like or cost-per-click will be lower for more interesting industries. This isn’t a bad thing—less interesting industries often have business models that make more per customer so as long as they’re making a profit on the user, those industries are happy to pay a bit more to acquire customers.

Based on our findings, these verticals are the least expensive for Facebook:

  • (CPM):
    Consumer Electronics, Consumer Packaged Goods and Home Improvement were over 60% cheaper than average.
  • (CPC):
    Gaming, Electronics, Entertainment, and Automotive were 20% cheaper than average.
  • (CPL):
    Cellular/Telco, Gaming, Desktop Software, and Consumer Electronics  were over 50% cheaper than average.

Similarly, these verticals were most expensive:

  • (CPM): Automotive and Education were over 60% more expensive than average.
  • (CPC): Education, Alcohol, and Home Improvement were over 40% more expensive than average.
  • (CPL):  Education, Food, Home Improvement, and Financial Services were all over 20% more expensive than average.

Finally, there is a wide disparity between verticals based on CTR:

  • Food, Gaming, and Automotive were over 25% more likely to be clicked than the average Facebook ad.
  • Alcohol, Education, and Home Improvement had a 70% lower clickthrough rate than the average Facebook ad.

Download the full report here: http://www.unifiedsocial.com/data-study/facebook-advertising-benchmarks-industry-vertical/

If you have questions about this research, or would like to be subscribed to future research reports, please email us at research@unifiedsocial.com.

Track social ROI across multiple channels

*Content originally written by Fred McIntyre and published on awe.sm blog

When I joined as awe.sm’s CEO a few months ago, I outlined the excitement within the social marketing landscape, and the incredible opportunity to help business better navigate and understand the growing global social media audience.

By the end of this year, there will be over 1.8 billion people using social media — and the dollars brands are budgeting in outbound social marketing are growing at a fast clip too.

image

In July, we rolled out awe.sm for marketers, which built on the capabilities of awe.sm’s excellent developer platform to equip marketers with easy-to-use social media analytics tools. Uptake in the market has exceeded our expectations.

Brands are looking for ways to connect outbound social marketing efforts with real, dollars-and-cents, consumer actions. Marketers today — 85% in a recent CMO study — either don’t know or have only a “qualitative feel” for how the dollars they spend on social marketing deliver performance against real business goals like purchases or newsletter sign-ups. Finding ways to measure the ROI of the dollars being spent on social media marketing, and using this intelligence to reach business goals, has eluded most marketers.

Today, awe.sm is taking the wraps off a solution. What we’ve built gives marketers a single source — think of it as a powerful telescope — to get a clear picture of what had been a murky “dark social” universe. It’s an all-in-one dashboard within awe.sm that gives brands and agencies a very precise view of how different social channels drive conversions — sales, registrations, or other consumer actions — in direct comparison. I’ll be demonstrating it today at the iMedia Breakthrough Summit’s Next Wave Competition & Showcase in Austin. You cancheck out our media announcement here.

We’re big believers in social media’s potential and influence. Helping business more effectively navigate and measure this world will drive innovation and growth. I’m really excited about what the team here at awe.sm has built and can’t wait to show you how well it works.

Infographic: Automotive Advertising on Facebook

Nearly 85 million cars are produced globally each year, and smart automotive marketers have found remarkable success using Facebook to reach consumers.

Our latest infographic explores how auto differs from other vertical markets on Facebook, why the mobile News Feed is key to marketing success, and how men and women interact differently with auto advertising.

Read on to learn more about what drives marketers’ automotive success.

As with all of Unified’s infographics, feel free to repost using the embed code you’ll find here.

Automotive Facebook Advertising Benchmarks
Older posts

© 2014

Theme by Anders NorenUp ↑