The Unified research team has unique access into one of the social marketing industry’s deepest data sets. One of the most common requests we receive is “Can you give us benchmarks specific to our industry? Average benchmarks aren’t useful to us because everyone in our industry [under/over] performs the average.”
When you think about it, such requests make complete sense. For example, an ad for a new movie will perform very differently than an ad for a bank.
In response to repeated requests, today we’re releasing a new report measuring Facebook ad performance across fourteen different industry verticals.
tl;dr: Want to go straight to the report? Download it here:http://www.unifiedsocial.com/data-study/facebook-advertising-benchmarks-industry-vertical/
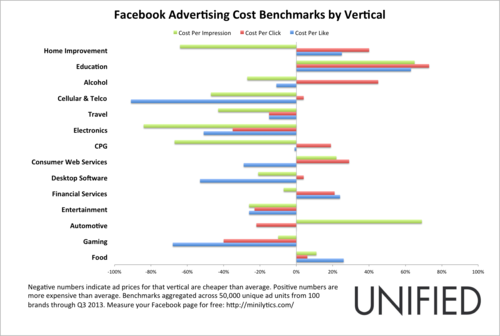
This report examines cost per impression (CPM), cost per click (CPC), and cost per like (CPL), as well as clickthrough rates (CTR).
Some highlight findings:
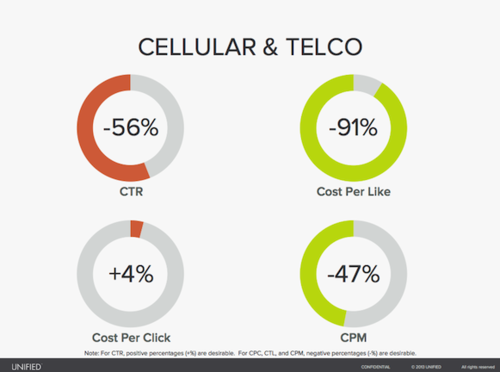
- Ceullular & Telco advertisers acquire fans 91% cheaper than average.
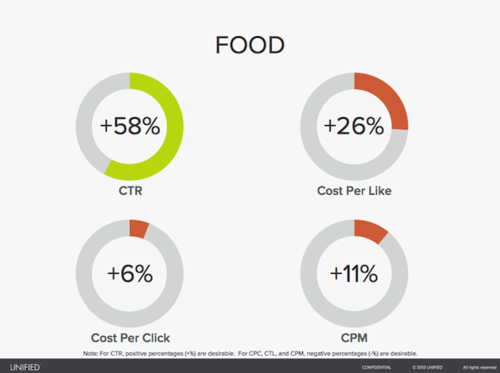
- Food ads are 58% more likely to be engaged with than the average Facebook ad. This is twice as high as any other vertical.
These are the industries we benchmarked:
- Alcohol
- Automotive
- Consumer Packaged Goods (CPG)
- Education
- Electronics
- Entertainment
- Financial Services
- Food
- Gaming
- Home Improvement
- Consumer Web Services
- Desktop Software (No games)
- Cellular & Telco
- Travel
Download the full report here: http://www.unifiedsocial.com/data-study/facebook-advertising-benchmarks-industry-vertical/
If you’re a social marketer, one of the first questions that should spring to mind when looking at this data is, “How can I use this data to improve my campaigns?”
Use the metrics to identify where you should focus on improving. Some industries excelled at getting initial user engagement but struggled to turn those users into fans. So those industries should optimize what happens to a user after they initially engage with an ad. Some industries had a lower than average engagement rate, but those users who did engage were highly engaged. Those industries should work harder to drive that initial user response because the rest of their marketing funnel is already highly-optimized.
These verticals had lots of clicks, but relatively low percentage of clicks converted into fans:
- Food
- Automotive
- Financial Services
Ads for these verticals had a low engagement rate, but users who clicked were very likely to convert into fans:
- Cellular & Telco
- Gaming
- Desktop Software
- Alcohol
If you’re in this group, experiment with broadening your targeting a little. Yes, the followthrough rate will probably slightly decrease, but you might be surprised to find that your ad cost decreases even faster, resulting in an overall lower cost per acqusition.
As you flip through the report, you’ll notice there’s a massive disparity between different industries. Two primary reasons for this:
First, different target markets vary in competition for users’ attention. For example, an industry that primarily markets to moms tends to have far more competition than an industry that markets to teenage girls. Moms have a lot more spending power so there’s a lot more advertisers who want to have their ad placed in front of that mom, so they bid up the prices for those ad slots. An advertiser who can make 50% more profit from a mom is happy to pay 40% more to reach moms than teenagers because that leads to a 10% profit boost.
Second, even within the industries vying for the same target market, some of those industries are more interesting to users, which means the more interesting ads will require fewer ad impressions to drive the same engagement level. For example, an ad for a popular movie generally requires fewer ad impressions to convert a user into a fan than an ad for insurance. So any ad prices that include user behavior, such as cost-per-like or cost-per-click will be lower for more interesting industries. This isn’t a bad thing—less interesting industries often have business models that make more per customer so as long as they’re making a profit on the user, those industries are happy to pay a bit more to acquire customers.
Based on our findings, these verticals are the least expensive for Facebook:
- (CPM):
Consumer Electronics, Consumer Packaged Goods and Home Improvement were over 60% cheaper than average. - (CPC):
Gaming, Electronics, Entertainment, and Automotive were 20% cheaper than average. - (CPL):
Cellular/Telco, Gaming, Desktop Software, and Consumer Electronics were over 50% cheaper than average.
Similarly, these verticals were most expensive:
- (CPM): Automotive and Education were over 60% more expensive than average.
- (CPC): Education, Alcohol, and Home Improvement were over 40% more expensive than average.
- (CPL): Education, Food, Home Improvement, and Financial Services were all over 20% more expensive than average.
Finally, there is a wide disparity between verticals based on CTR:
- Food, Gaming, and Automotive were over 25% more likely to be clicked than the average Facebook ad.
- Alcohol, Education, and Home Improvement had a 70% lower clickthrough rate than the average Facebook ad.
Download the full report here: http://www.unifiedsocial.com/data-study/facebook-advertising-benchmarks-industry-vertical/
If you have questions about this research, or would like to be subscribed to future research reports, please email us at research@unifiedsocial.com.
Recent Comments