Month: June 2013

Introducing Monitoring, Editing & Creation of Twitter Ads

Yesterday, we announced the integration of Twitter’s Ads API with our Social Operating Platform, making Unified one of only two companies in the world with Ads API access to all three major social networks – Facebook, Twitter and LinkedIn.

This integration was much more than just adding a few form fields and API calls – we thought hard from the ground up about how to create the simplest and fastest interface to manage thousands of ads across dozens of accounts.

We’re really proud of the Twitter product we built over just eight weeks, and excited to continue building the absolute best product for our customers. Today I want to share three fundamental principles that have guided our design and engineering process so far.

Design to match data structure

Advertising data is like a set of Russian Dolls – deeply nested data structures that in their simplest form look something like:

image

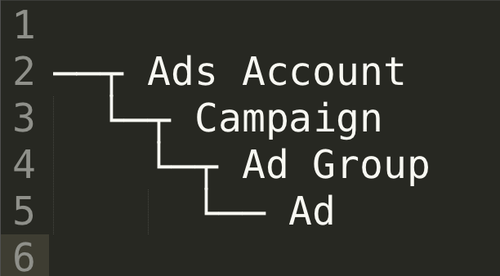
When we started prototyping, the goal was for our product to help customers understand this information hierarchy and use it to their advantage.

In order to reflect this hierarchy in our design, we hacked around CSS, HTML tables andbackgrid.js to create this:

image

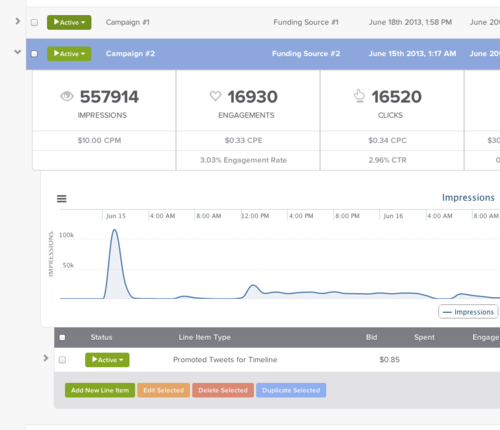
Each campaign row expands and collapses, clearly displaying the full hierarchy and interface without navigating back and forth between pages and views. Analytics, editing, and creation all happen from the same interface, helping you make smarter decisions about your campaigns.

We’re really excited to continue refining this approach and finding the best design pattern for nesting and mixing tabular and non-tabular data like this. (if you have ideas, we’d love to hear from you)

When editable data is visible, it should be editable in-place

image

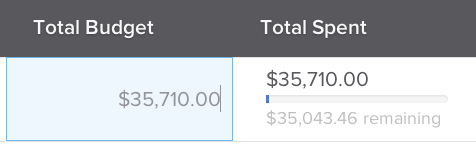
If I can see my campaign budget, why shouldn’t I be able to click on it and change it right away?

When we looked at other designs for editing ads, one anti-pattern we found was a reliance on multi-step wizards to make simple changes. Wizards are ideal for guiding new users through a process, but using them for editing is a crutch.

By allowing quick Excel-style edits, we were able to reduce the time it takes to make changes down to less than a second – just click, edit, and hit enter.

Confirm success and explain failure

When an advertiser has hundreds of thousands of dollars at stake, it’s absolutely essential to provide them with confirmation that each action they take in our application succeeded or failed.

We do this by hooking messenger.js into every action and displaying a small notification in the bottom right corner of the browser window:

image

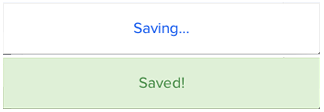
As a user, you shouldn’t have to wonder whether your request to the API worked, or whether your spotty 3G connection sent your changes – you should always have full visibility into both success and failures.

Looking to the Future

With a solid foundation to build on, we’re excited to keep building and focus on solving the challenges that our biggest advertisers face, from multivariate testing to automated targeting and beyond. Expect to hear more from us here on the blog as we keep building and making it easier to create and manage Twitter campaigns.

What’s the social calculus of comments? (And why should you care?)

We recently had the opportunity to present at the DataWeek Disqus Summit. Here’s a recap of our presentation, led by awe.sm’s Fred McIntyre and Disqus’ Ro Gupta.

The term “social media analytics” is thrown around frequently, but publishers and marketers still struggle to find meaningful, actionable insights into how social media drives actual business results. Fortunately, awe.sm can help.

For an example of the kind of useful findings that performance analytics can reveal, we analyzed commenting and sharing data collected by Disqus, which powers commenting on over 2.5 million websites, and awe.sm. Our findings revealed a huge opportunity for content publishers and their community managers.

The publisher funnel

image

Marketers are familiar with the concept of a sales funnel, but it applies to content publishers, too. Think of visits at the top of the funnel, pageviews the next level down, then engagement (comments) and amplification (organic sharing).

Filling the top of the funnel by acquiring traffic and increasing pageviews is a discipline unto itself. But we were interested in whether page engagement and amplification at the bottom of the funnel can help broaden the funnel’s top. Also, how are commenting and sharing behavior related to one another?

Both Sides of the Table Comment Section

When a website uses awe.sm’s earned-media measurement, we track every individual share of its content by site visitors: not just where it’s shared, but how many clicks it drives back to the site, and what on-site events take place after that. As we announced back in July, among the specific goals we can track is Disqus-powered commenting — i.e., which comments came from visitors driven by each Tweet, Pin, or Like?

image

One website that benefits from this visibility is Both Sides of the Table, the blog of venture capitalist (and awe.sm board member) Mark Suster. Mark gave us permission to explore the sharing and commenting on recent posts to see what we could learn, and the results didn’t disappoint.

Let’s scrutinize a single conversation.

In the beginning was the Tweet…

A few weeks back, Mark published this Tweet to over 125,000 followers:

image

The Tweet brought 777 clicks to his post, and resulted in 3978 pageviews (!), 5 new social followers, 13 comments on the original post or elsewhere on his blog, and 8 re-shares — social posts made by individuals who either clicked share buttons on the blog, or copied a page’s tracking link out of the address bar and pasted it into their own social workflow.

Here’s one of the shares, to a LinkedIn group for doing business in British Columbia:

image

This LinkedIn post drove 122 clicks back to Mark’s blog, 156 pageviews, an additional Twitter follower, and this Disqus comment:

image

… which led to another LinkedIn post. That post drove 5 more clicks and additional pageviews.

If you’re keeping score at home, that’s a Tweet to a blog post, which led to viewing another blog post, which led to comments and a LinkedIn post, which sent more pageviews and comments on the blog, which led to another LinkedIn post…

image

…and remember, this is just a single conversation path.

For more highly-trafficked blog posts, it’s easy to amass thousands of nodes, four or more generations deep. The quantity of available data, potentially the relationship between every comment, every social share, and every pageview, is — wait for it… — awesome.

Consider that these conversations already were taking place, without being attributed or adequately understood, and it’s possible to grasp what’s possible for the first time by using a closed-loop system to connect all the social dots.

This level of visibility makes it possible to identify which conversations drive visits and pageviews, which social posts create value, and, ultimately, the ROI of each share.

What can we learn?

When we analyzed social posts, pageviews, comments, and organic sharing across a larger data set, we found two striking conclusions:

  • Commenters — visitors who leave at least one Disqus comment on a site’s content — are 23% more likely to share site content to a social network than non-commenters.
  • Those commenters’ social posts receive 80% more clicks per post than shares of this same content by non-commenters.

In our view, it’s not surprising that people who engage with content in its comment section aremore likely to share the content on social networks, too. Having something to say about a given article is a good predictor for your inclination to share it with others.

It’s somewhat more surprising that these commenters are also more effective sharers. We’ll leave exploring the explanations for this (do people who comment also have more social followers?; do they write more compelling Tweets?…) for another time.

Regardless, these figures quantify the relationship between engagement and amplification, and raise a huge opportunity for publishers and community managers.

Now that we know that conversations drive amplification, and now that it’s possible to identify which conversations and participants are most influential at driving amplification, you’re equipped with a powerful tool for optimizing conversations, nurturing influencers, and increasing traffic and pageviews.

What you do with this knowledge is up to you, but collecting it should be your top priority.

*Originally published on awe.sm blog

Introducing awe.sm’s integration with Gumroad

One of awe.sm’s most powerful features is the ability to track your social sharing through to conversions on your site or in your app. Now, it’s time for your Neo “Whoa” moment: Social ROI!

This is particularly useful if you’re tracking how social networks drive purchases. You can assign a quantified amount to each Tweet and posts. However, if you’re using a 3rd-party storefront to process your sale, there has been no way to associate purchases there back to your shared awe.sm links.

Until now.

awe.sm has teamed up with Gumroad. Starting today, you can seamlessly track purchases that begin with clicks on awe.sm links and end in a Gumroad storefront.

Let’s try it out: check out the Tweet below. When my followers click the awe.sm link and buy that sweet Steve Aoki shirt — do this! — it triggers an awe.sm conversion, so that I can attribute every purchase directly back to that Tweet. Social marketers, rejoice!

Check out this tutorial on how to set up your awe.sm and Gumroad accounts.

If you have any further questions, feel free to contact us.

*Originally published on the awe.sm blog. 

© 2014

Theme by Anders NorenUp ↑